


Post by Admin on Nov 7, 2019 2:08:53 GMT

What are the natural drivers of temperature and its variability?
What does the projected natural increase in temperature mean for the environment and people?
What does the increase in greenhouse gases from human activity mean for oceans, environment, animals, habitats, and humanity?
Is Decarbonation the Right Solution?
Let’s look with fresh eyes and see what we can learn.
1. What are the natural drivers of temperature and its variability?
Incoming solar radiation is the primary driver of temperature. A second factor is the atmosphere, which traps heat and reflects some of it back to earth. Other factors play smaller roles. I’ll start with the familiar greenhouse-gas model and then present a more accurate picture based on solar activity.
The Greenhouse Effect
In this section, I focus on CO2 because it’s regarded as the main greenhouse gas after water vapor. Looking at the 750-million-year graph below, we see some extreme cold periods, then warm epochs punctuated by ice ages, all while CO2 (yellow) was far above what it is today. There is almost no correlation between temperature and carbon dioxide until about ten million years ago.

Starting around a million years ago, the curves start to sync up, and we see a pretty definitive supercycle of about 100,000 years for both:
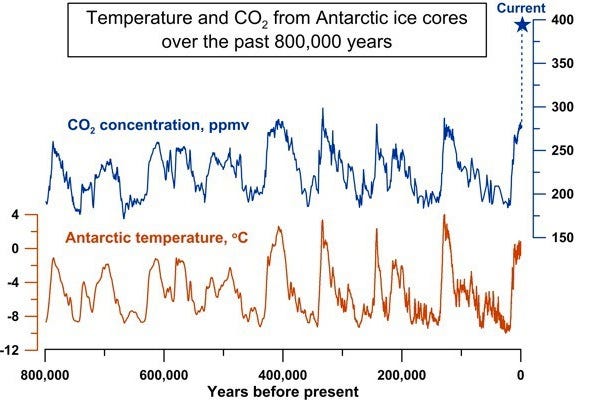
Think about that: CO2 had no correlation with temperature for more than 2 billion years, and now it’s causing temperature to rise? Something’s going on, but what? Let’s zoom in:

Notice that temperature generally changes first, and CO2 changes some 800+ years later. Blue line to the left, red line to the right. This is called the temperature lag — an inconvenient truth for CO2-warming enthusiasts; it’s well known but not well understood. It could easily be a complex relationship, but CO2 changes do not initially cause historical temperature changes.
On a shorter time scale, we start to get some perspective:

At this scale of 11,000 years, it doesn’t seem like CO2 is “driving” temperature. We are in the middle of an upswing coming out of the Little Ice Age, but there is also an overall cooling trend.
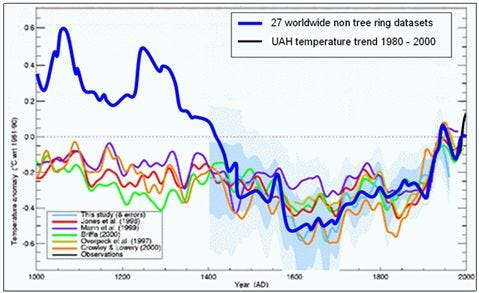
Before the twentieth century, there was plenty of temperature variability, and it continues today. If you have heard about the hockey-stick controversy, it’s about whether this graph created by Michael Mann, which Al Gore likes to stand in front of on a scissor lift, represents reality:
It doesn’t. Despite what you read on Wikipedia, this graph was manufactured by carefully cherrypicking the data from tree rings. Looking at tree rings is about the least accurate way to measure ancient temperatures. Better methods involve looking at drilled ice and sediment cores. Using those methods, we see a pronounced period warmer than today from 1000 to 1300 AD, called the Medieval Warm Period, and then the Little Ice Age about 400 years ago (same time period as above):
This single issue invalidates many of Al Gore’s claims* and undermines the IPCC’s predictions of man-made CO2 catastrophe. (You’ll find a list of relevant studies at CO2Science.org*.)
There is a very good video showing how NASA has been “warming” their data and that today’s NASA data doesn’t agree at all with their data from 2000. I highly recommend watching:

Where Does the Data Come From?
For the last 80 years, we have far more accurate ways of recording temperature, so the far right hand side of the graph above should come from direct measurements. Weather stations that gather this data differ in quality and consistency, especially over decades as the areas around them develop. A large-scale reassessment of all US weather stations from 1979 to 2008 carefully divided the stations into five classes, from best quality (I) to worst (V). For this period of time, they calculated the per-decade average temperature increases, and found:
Class I and II only (most accurate): 0.155 C
Class III, IV, and V sites only: 0.248 C
NOAA 2015 “adjusted” calculation: 0.309 C
What does that tell you? NOAA is “adjusting” their data to increase warming figures far out of the realm of possibility. The IPCC relies mostly on NOAA data and other similarly adjusted data, which conveniently provides an instant doubling of temperature increase, making all the graphs much steeper after 1980.
The science is extremely complex and uncertain. If you have blind faith in the wrong numbers, you’re going to jump to the wrong conclusions. Anthony Watts has carefully reviewed NOAA’s data and found unscientific manipulation. Watch this 15-minute video* and decide for yourself*:
NOAA continues to “adjust” their data, manufacturing graphs that support the cause.
Note: It’s easy to find nonscientific articles and videos that “prove” the hockey stick has been validated by updated research and that the sun’s energy doesn’t fluctuate. However, one central tenet of journalism is that you can’t fact-check a source by asking the source, and that’s exactly what most journalists are doing. To fact-check the IPCC, look at the peer-reviewed literature written by scientists who are not in the IPCC.
That’s the greenhouse-gas theory. Now on to more recent research.
Solar Forcing
Many solar variables contribute to the variance we see in temperature: distance, orbit cycles, axis tilt, magnetic fields, sunspots, solar wind, cosmic rays, the passage of earth through our galaxy, etc. Even though the total energy coming from the Sun is nearly constant, a) those tiny fluctuations can make a difference, and b) there are many other factors that can and do change. In particular, magnetic field changes can have significant influence on the shape of the jet stream, and that can influence cloud formation.
Willie Soon, a solar physicist, showed that the tiny variations in incoming solar radiation can have a more direct effect on temperature than CO2 does, but it takes very sensitive measurements and careful analysis to see the signal. Willie and his team first did many months of inspecting data from weather stations in the Northern Hemisphere*, throwing out spurious and made-up measurements, to put an accurate temperature picture together (blue line):

Then they plotted total solar irradiation (TSI) and found a very good first-order correlation, much better than with CO2. The graph above is probably the most accurate picture we have for that time period. Below is a similar exercise for the United States:

Note that this graph accurately shows the most recent cooling trend since 1998 without any hand waving.
Not only do fluctuations in solar energy drive changes in climate, the oceans react to increases in solar energy by generating clouds that help regulate temperature. Since 2013, much research has been aimed at constructing a more accurate picture of past temperature/solar radiation correlation and developing a realistic solar-driven climate prediction model*, taking the greenhouse effect into account.
Sunspots
Sunspots fluctuate in roughly 11-year cycles. It’s complicated, but in general these cycles show a moderate amount of correlation with temperature. The period of no sunspot activity 400 years ago corresponds to the Little Ice Age, when winters were significantly colder than they are today.

The current cycle peaked in 2014. Solar experts speculate that the next cycle, which starts in 2020, will have fewer sunspots. If that turns out to be true, temperatures could be heading down, rather than up. Reactions to this cooling prediction range from “unlikely,” to “plausible,” to “probable.” Whatever mechanism causes sunspots could be part of the picture, but there are several different solar cycles, different research approaches, and competing theories. They are converging, but it’s a complex work in progress. A single predictive model is still years or decades away.
Hottest Year on Record?
When you hear claims of this year being “the hottest year on record,” you should understand that 1922, 1998, and 2010 were also extremely hot, and the El Niños were extreme then as well. That’s not a trend; that’s a local peak. Look at the last 18 years from satellite data:

How many peaks do you see that are higher than this year’s? Now look at the scale — it’s one degree Celsius from top to bottom. To give you a sense of how up and down this really is, I traced the graph above and put it in perspective of the 20 degrees C (36 degrees F) we might experience in a single day:

Same data, different perspective. Can you see the hottest year on record now? In any given year, several weather stations will record dramatic “all time highs” with no effect on global temperatures.

2. What does the projected natural increase in temperature mean for the environment and people?
Sea level won’t likely rise in response to increased CO2. For starters, sea level rises and falls more than people think. Global mean sea level rose about 15 cm (6 inches) in the twentieth century. The IPCC models predicted higher levels by now, but researchers have found no link between CO2 and sea level. Sea level rises linearly; the rate of rise is not increasing. Any rise so far is very much in line with natural factors, not man-made. Estimates range from 5-20 cm (2–8 inches) of sea level rise (naturally) by the end of this century.
Reef systems and marine life will not likely be harmed by additional CO2. Researchers use tank experiments and computer models to predict doom and gloom (this approach is full of errors). Recent observations show that the Great Barrier Reef has been bleaching and recovering naturally for hundreds of years. Despite what you read in the press, no one has yet seen any verifiable signs of manmade CO2 effects, or even pollution. Coral bleaching is a natural phenomenon caused by temperature changes, especially in El Niño and La Niña years — it’s been going on forever. Live reef experiments have shown that coral polyps adapt well to changes in pH, but sunscreen is toxic. Furthermore, a recent metastudy found no evidence of harm due to “ocean acidification” and no likely harm in the future. If you care about ocean life, stop eating it! Stop developers from replacing estuaries, wetlands, and mangrove swamps with condos. And please stop eating shrimp immediately.
Freak storms are a far bigger threat. Again, storms are not caused by global warming. Over the next hundred years, as our population reaches nine billion or so, we should expect extreme events to have catastrophic consequences around the globe as a result of massive-scale urbanization and natural variance . Damage figures will rise significantly as we build larger cities on the coasts and expensive buildings with sea views. Don’t be fooled by graphs showing rising damage figures — they are guaranteed! The science is settled on this — even the IPCC admits that none of it is driven by CO2.

Let’s talk about polar bears. The health and numbers of the Arctic’s 19 polar bear populations are in very good shape, better than in decades*. Mitch Taylor, who has studied polar bears for over 30 years, says populations are increasing and very resilient. Each year at least 600 polar bears are shot, killed, and eaten by hunters — did your favorite news source tell you that? Arctic sea ice grows and shrinks by an area almost the size of the continental United States every six months. As the planet gently warms, the overall trend for slightly less ice each year continues; all the animals who live there have been dealing with this kind of fluctuation for millions of years. International fishing and seal hunting quotas have more to do with polar bear numbers than temperature does.
Furthermore, Greenland is not melting into the sea because of global warming. Greenland’s temperature fluctuates all by itself and always has.
Far from the land of polar bears, we hear tales of extreme temperatures melting Antarctic ice sheets the size of Wyoming. Despite the fact that glaciers fall into the ocean dramatically each year, Antarctica’s ice is actually increasing (reason: it snows in Antarctica, but snowfall doesn’t make good news footage). Imagine a time-lapse movie of Antarctica over the past million years or more: we see huge amounts of ice accumulating, moving, dropping into the sea, over and over. We shouldn’t be surprised to watch the Larsen B ice shelf fall into the sea — it should take extraordinary evidence to convince us that this is not natural. To think Antarctica should stay the same as it was when we were children is to commit the error of base-rate neglect. Remember this: the Arctic is losing a bit of ice each year, and the Antarctic is gaining a bit. Not much. And not quickly.

3. What does the increase in greenhouse gases mean for oceans, environment, animals, habitats, and humanity?
This is the domain of climate models. I could write twenty pages, but I’ll summarize my research:
According to Bob Tisdale, a researcher I respect after reading his book Climate Models Fail, the IPCC models simply aren’t skillful. They failed to predict the past twenty years, they don’t realistically model the cloud response, and there is simply too much uncertainty about the inputs to get decent outputs.
NASA GISS, in realizing that global temperatures refuse to conform to their models, has said that the increase in heat is trapped in the oceans. This bit of model trickery also does not stand up to careful analysis.
The IPCC models are falsifiable — if temperature doesn’t go up over the next ten years or so, we will have to agree that the IPCC models are, and always were, dead wrong. It is not looking good.
According to J Scott Armstrong, all climate models so far don’t meet the minimum criteria for a skillful forecast. He has testified before congress on climate forecasts, polar-bear counts, and other misconceptions. Here is his 15-minute talk:
Armstrong and other modeling experts say the simple “no change” prediction is often far superior to a complex one with many independent variables. In that case, we can predict about another one-degree C rise for this century, and another 3–7 centimeters of gradual sea-level rise.
Correlation is not Causation
Killer storms. Bee colony collapse. Mosquito-borne diseases. Ticks heading south for the winter. Heat-related deaths. Arctic lobster populations. Algae blooms. Global temperatures. These things may or may not be increasing, but let’s assume they are. Atmospheric carbon dioxide is also increasing. So are the number of toilets made every year and the number of vinyl records sold. When a particular scientist issues a press release describing the future collapse of ecosystems, I recommend asking “What evidence do you have?” When they say something we can see today is due to “anthropogenic global warming,” they are saying that the extra 120 parts per million of CO2 in the atmosphere — about 30% of the total — are causing the phenomenon right now, as opposed to all other possible natural explanations, including variance. I recommend asking, “How can you be sure?” Just because we haven’t seen something in the past century doesn’t mean it wasn’t going to occur anyway.
This is the scientific method — ask hard questions, develop hypotheses, and try to disprove them. Not only do we need better models, we need to be empirical, not hysterical. We need to look at the data and separate the signal from the noise. The majority of single papers showing research results are simply wrong. To get a better picture of scientific findings, one of the best tools is the metastudy.
We only have two so far, but they are significant: one on temperature, and one on ocean acidification. Anyone who claims otherwise is going to have to explain why his/her claim invalidates the metastudies. That’s a lot to ask, but this is the level of proof science demands.
Okay, but even if there’s a lot of uncertainty, what about the small possibility that something really bad could happen? Shouldn’t we put money and resources into doing something, just as an insurance policy?
We could, but we have to balance that against buying other things with the same money and effort*. Right now, some ecosystems are fragile and threatened by humanity, while many others are already repairing themselves*. The focus on CO2 may be misplaced. It’s not the CO2 that causes choking smog in Los Angeles, it’s the rest of the mix that comes from the power plant and out of exhaust pipes. It’s the fact that China needs to build a new city the size of Phoenix every month for the next 15 years. More people are eating a western diet, contributing to deforestation and wasting resources. Overfishing is a crisis in progress. This and much more is actually happening today, not in a computer model.
The Bush administration held up the Kyoto agreement, yet they spent trillions on a war based on no verifiable evidence to prevent a future that was never going to happen. Should we really do the exact opposite?

Enter Bjorn Lomborg, the “skeptical environmentalist,” who has spent his mediagenic career trying to prioritize our efforts to save the earth and humans along with it. According to his calculations, the EU’s goal of spending $250 billion per year until the end of the century will result in — and this is not a typo — 0.1 degree lower temperatures.
Lomborg’s book, Cool It, and movie of the same name, are excellent (though for some reason he believes the IPCC projections). He says we should switch to renewable sources of energy, but for the right reasons at the right price.
That’s my attempt to answer the four questions. For a good summary, see Nir Shaviv’s paper or Bob Tisdale’s excellent ebook. In the next three sections, I’ll quickly list people not to listen to and why, then I’ll list people I think we can trust.


